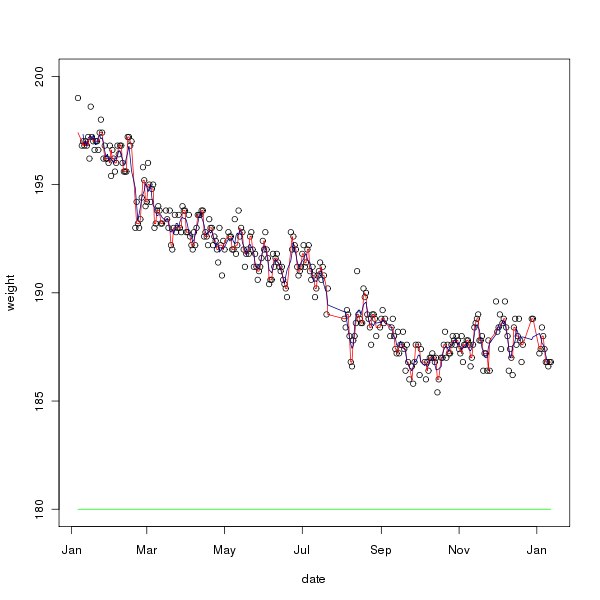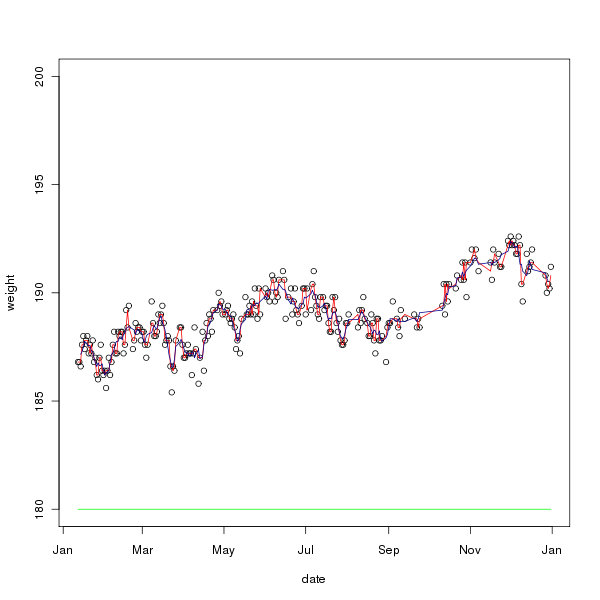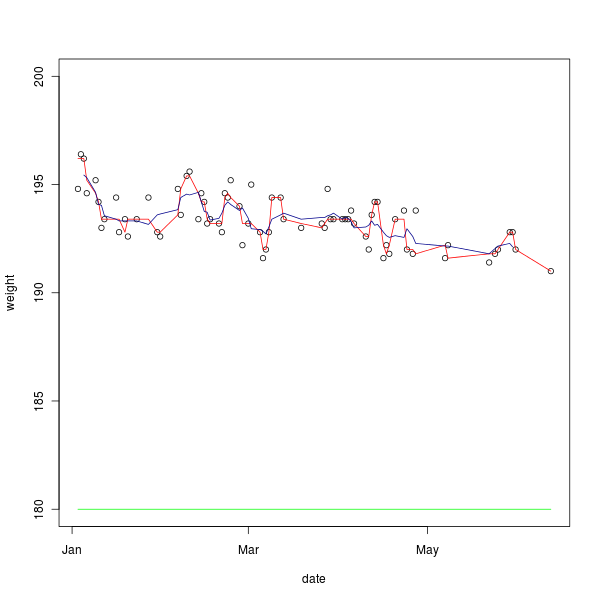
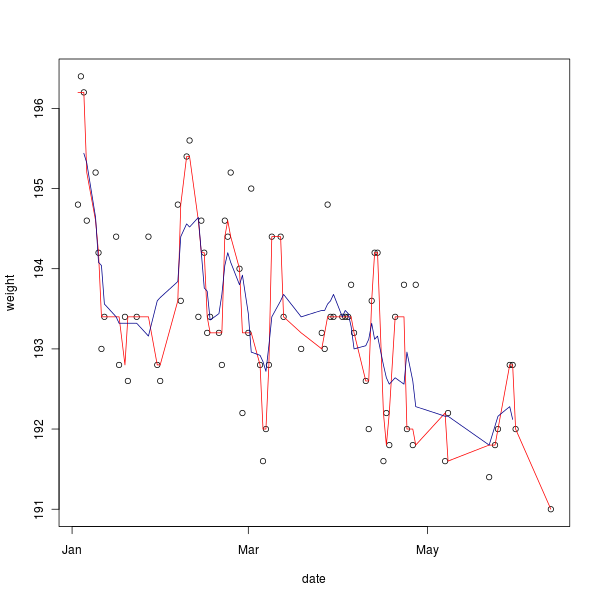


The points are my weights, the red line is a rolling median of 3 data points, and the blue line is a rolling mean of 5 data points.
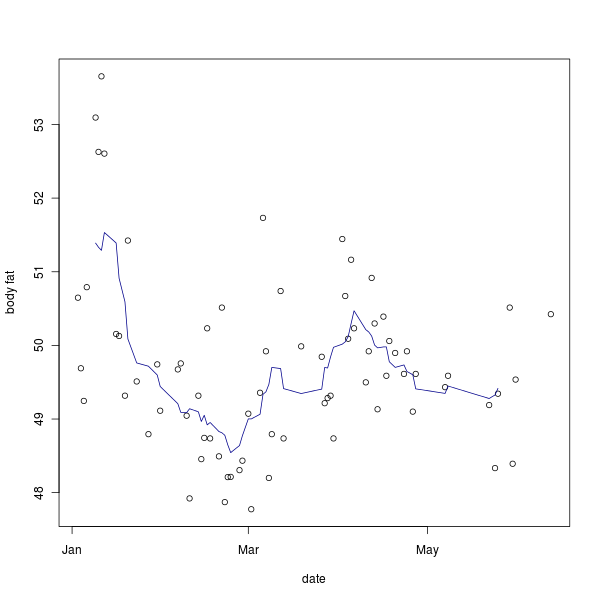
About this project: I'm trying to lose weight, and I've started weighing myself every morning to keep track of how I'm doing. The smoothing lines are calculated in R. Here's the script I used to generate the plots.
Results for 2009/2010: