New: Here's an updated visualization, made with Tableau Public:

I was curious about how our home energy usage varied with respect to
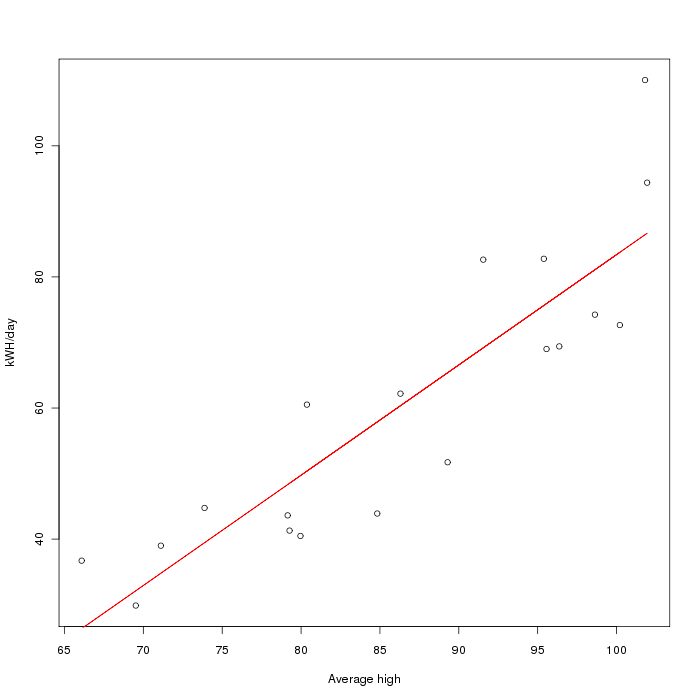
temperature, so I made some graphs with R. The first graph is a graph of the average high temperature in Austin versus our
kWH/day energy usage (see where I got the data from) with
a fitted linear regression line. The slope is 1.68, indicating that for every
degree hotter it gets, we spend 1.68 kWH extra per day.
However, the line is not a great fit for the data (R-squared is 0.7778), so
I decided to look at a plot with the dates (in "year-month") on it:
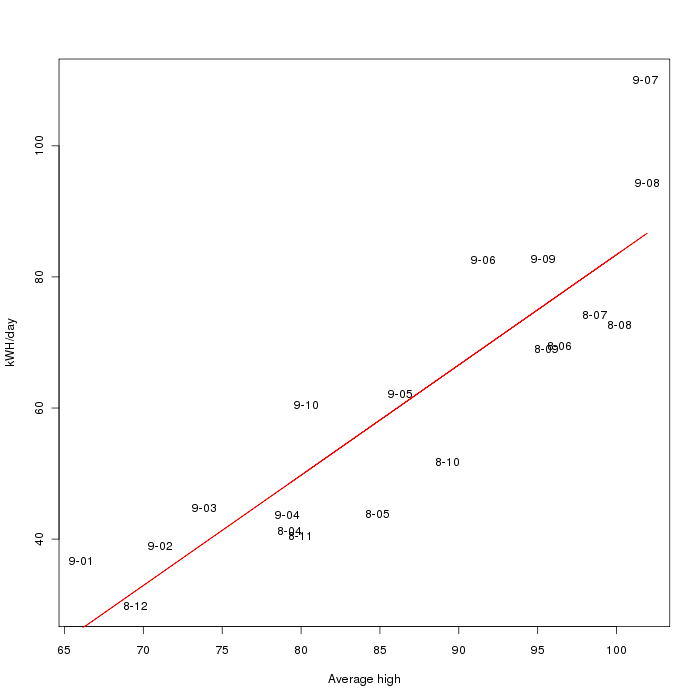
Aha! It looks like there's something else going on - almost all the 2009
entries are above the line, and all the 2008 entries are below the line. If
we split these up into two regressions, we get:
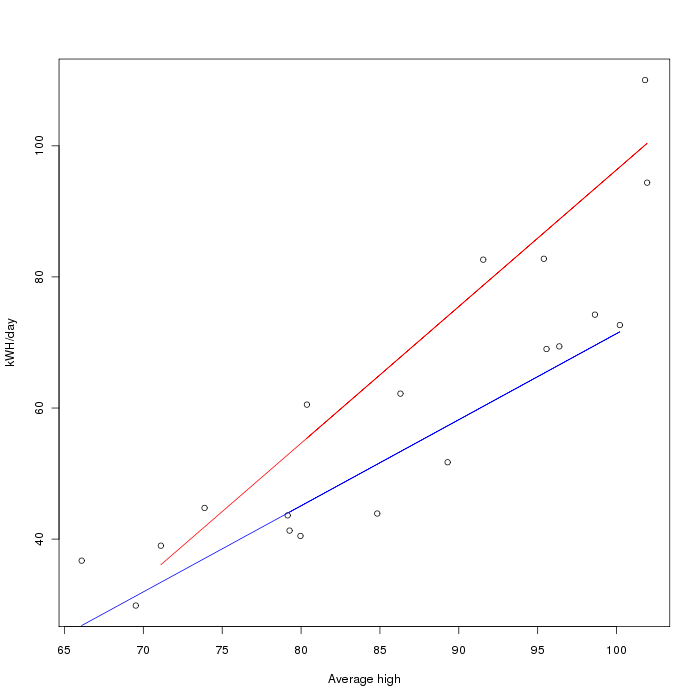
The blue line (for 2008) has slope 1.31 with R-squared 0.8979, and the red line (for 2009) has slope 2.086 with R-squared 0.9344.
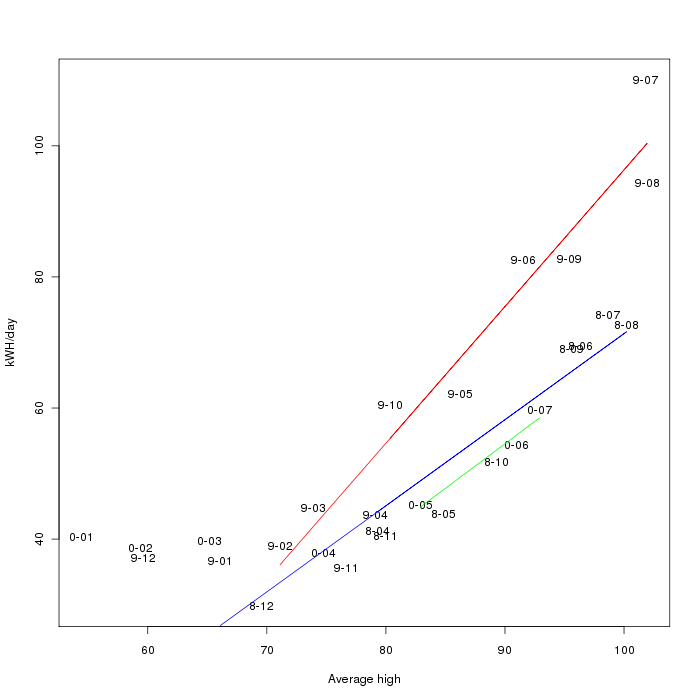
Updated graph with new months:
About this project: The temperature data was taken from a few places: firstly this infochimps data set, augmented with the preliminary reports from the National Climatic Data Center and the monthly reports from Camp Mabry.
For the energy data, I didn't have all of our old Austin Energy bills, but I did know how much they were for so I was going to estimate based on that. This turned out to be somewhat inaccurate, but I was able to sign up for an online account and get all the old data, which was extremely helpful since it had the kWH/day averages. (since billing cycles seem to range between 28 and 35(!) days)
After processing that, I loaded it into R, and did the following analyzes/plots:
temps <- read.table('austinaveragedata.csv')
kwh <- read.table('energyused.csv')plot(temps[[2]], kwh[[2]], xlab="Average high", ylab="kWH/day")
l <- lm(kwh[[2]] ~ temps[[2]])
plot(temps[[2]], kwh[[2]], xlab="Average high", ylab="kWH/day")
points(temps[[2]], l$fit, type='l', col='red')
plot(temps[[2]], kwh[[2]], xlab="Average high", ylab="kWH/day", type='n')
text(temps[[2]], kwh[[2]], labels=substr(temps[[1]], 4, 7), xlab="Average high", ylab="kWH/day")
The output of the regressions was:
> summary(l)

Call:
lm(formula = kwh[[2]] ~ temps[[2]])

Residuals:
    Min      1Q  Median      3Q     Max
-13.972  -7.556  -2.249   7.421  23.587

Coefficients:
            Estimate Std. Error t value Pr(>|t|)
(Intercept) -84.8509    19.0008  -4.466  0.00034 ***
temps[[2]]    1.6825     0.2181   7.713 5.98e-07 ***
---
Signif. codes:  0 '***' 0.001 '**' 0.01 '*' 0.05 '.' 0.1 ' ' 1

Residual standard error: 10.66 on 17 degrees of freedom
Multiple R-squared: 0.7778,     Adjusted R-squared: 0.7647
F-statistic: 59.49 on 1 and 17 DF, p-value: 5.98e-07> summary(lPre)
Call:
lm(formula = kwh[[2]][1:10] ~ temps[[2]][1:10])
Residuals:
Min 1Q Median 3Q Max
-7.5246 -4.1163 -0.2126 3.3127 9.9011
Coefficients:
Estimate Std. Error t value Pr(>|t|)
(Intercept) -59.9954 13.5826 -4.417 0.00224 **
temps[[2]][1:10] 1.3135 0.1566 8.388 3.1e-05 ***
---
Signif. codes: 0 '***' 0.001 '**' 0.01 '*' 0.05 '.' 0.1 ' ' 1
Residual standard error: 5.694 on 8 degrees of freedom
Multiple R-squared: 0.8979, Adjusted R-squared: 0.8851
F-statistic: 70.36 on 1 and 8 DF, p-value: 3.101e-05> summary(lPost)
Call:
lm(formula = kwh[[2]][11:19] ~ temps[[2]][11:19])
Residuals:
Min 1Q Median 3Q Max
-9.233 -5.572 2.896 3.918 9.919
Coefficients:
Estimate Std. Error t value Pr(>|t|)
(Intercept) -112.2145 18.2743 -6.141 0.000472 ***
temps[[2]][11:19] 2.0855 0.2088 9.987 2.16e-05 ***
---
Signif. codes: 0 '***' 0.001 '**' 0.01 '*' 0.05 '.' 0.1 ' ' 1
Residual standard error: 6.812 on 7 degrees of freedom
Multiple R-squared: 0.9344, Adjusted R-squared: 0.9251
F-statistic: 99.74 on 1 and 7 DF, p-value: 2.158e-05